
Problem
Our mission at Duolingo is to develop the best education in the world and make it universally available. However, our metrics showed that millions of learners, especially those using entry-level devices in emerging markets, were quitting the app due to frustrating load times: in early 2024, a staggering 39% of users on entry-level Android devices waited over 5 seconds for the app to start. This directly undermined our mission of universal accessibility. To solve this problem, we assembled a dedicated team to optimize our Android app performance.
Identifying key metrics for A/B testing
At Duolingo, we have a strong culture of experimentation and metrics-driven decisions. For any challenge, our first step is to identify the right metrics to run tests on.
A common performance metric is latency, such as app startup time. However, latency doesn’t always translate into user engagement, which is our ultimate goal. Therefore, we decided to focus more on conversion metrics: the percentage of users completing a critical step, like opening the app and successfully reaching the home screen. This provides a clearer measure of impact on user behavior, directly influencing DAUs.
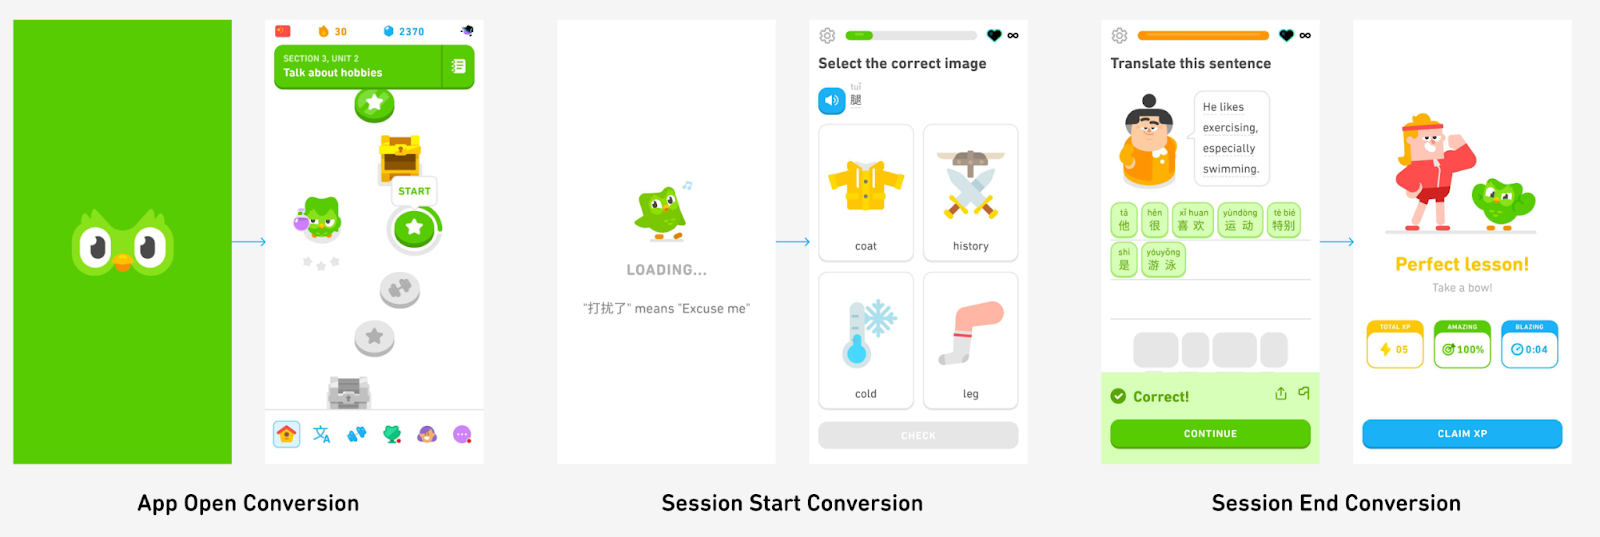
We prioritized conversion across three critical user journeys: app open, session start, and session end, with app open taking precedence given its top-of-funnel impact. We also established app open conversion as a company-wide guardrail metric to prevent other product experiments from introducing performance regressions.
Using and building the right tools
Our typical approach to diagnosing app performance issues follows four steps:
- Identify a slow user journey such as app start
- Annotate relevant sections of code with Trace markers.
- Capture a system trace of the user journey
- Visualize and analyze the trace in Perfetto
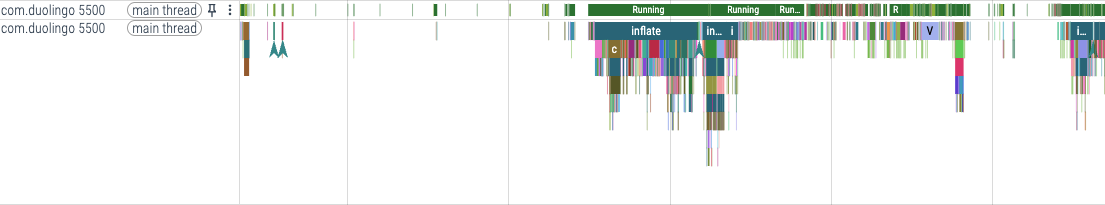
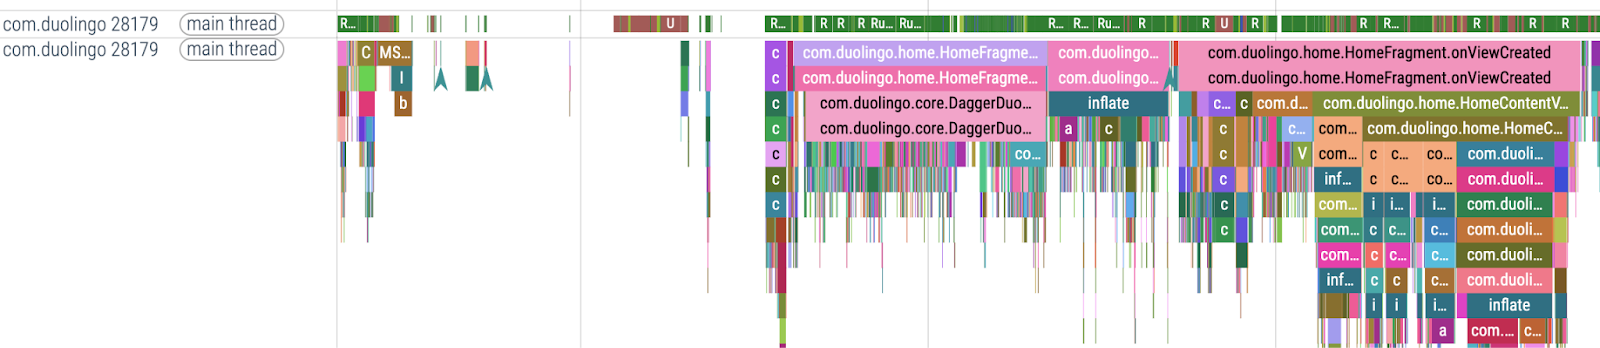
While there are numerous tracing tutorials available, I want to highlight a game-changing tool we built that transformed our workflow: automated method tracing.
Previously, to trace a method, we needed to manually add trace points.
Trace.beginSection("draw path node")
drawPathNode()
Trace.endSection("draw path node")
This was tedious and required constant app rebuilds to add more trace points – each taking up to 20 minutes. Our automated solution uses bytecode manipulation (via an ASM transform) and regex filtering to dynamically trace entire categories of methods (e.g. all methods in ViewModels, Activities, Fragments, Repositories) without code changes. You can refer to this gist for our implementation. It not only saved development time but also made the trace much more informational. Compare these before-and-after traces:
When analyzing traces, we focus primarily on the main thread since it directly reflects what users perceive. Two patterns consistently flag optimization opportunities:
- Idle Gaps: Sections where the main thread stays idle, often indicating it's blocked waiting for slow background work (like I/O) to complete before updating the UI.
- Extended Blocks: Long-running chunks of work on the main thread. These are prime suspects for causing frozen frames and even ANRs (Application Not Responding).
Now that we are equipped with the right tools, let's dive into some of the key strategies we employed.
Removing or deferring non-critical tasks
Early in our journey, we ran an audit of the app startup trace and found several tasks that weren't essential for getting the user to their first interaction. They represented some low-hanging fruits: by removing or postponing them, we achieved great results with minimal effort.
Case study: deferring ads loading
When the app was started, we used to immediately load up our ads libraries. Our system traces revealed something shocking: one of the libraries was initializing a WebView on the main thread, eating up over a full second of processing time!
Duolingo ads are shown only after a user completes a lesson, so the ads library initialization is not time-sensitive. By deferring it to occur after the app was fully loaded (when the CPUs are far less busy), we were able to cut our app startup time by around 1.5 seconds, and save 20,000 learners per day from quitting before entering the app.
This success inspired the development of our HomeLoadedStartupTask, a utility to easily run startup logic after the home page is loaded. We established this as a best practice for all non-critical startup logic.
Trim the fat: request only the data you need now
Another fundamental optimization strategy addresses data size: instead of fetching an entire dataset upfront, only request the specific portion the app immediately needs. Minimizing the data footprint lightens the load everywhere – reducing CPU processing time, memory usage, and network bandwidth consumption.
Case study: sectioning Duolingo's course
We faced this challenge at Duolingo with our ever-growing course models. As we kept adding content and lesson types, flagship courses such as English to Spanish are now multi-megabytes in size. They are slow to download, and de/serializing the course object could take several seconds.
Learners, however, only interact with a small part of the course at any given time. So, we undertook an effort to section the course into smaller chunks and update the app to fetch only the relevant piece. While it required substantial refactoring on both the backend and the client, the payoff was huge: we saw performance improvements across the board and a notable increase in DAU. More importantly, it unblocked new course features that were previously shut down due to performance regressions.
Optimizing network requests
In the last section, we briefly mentioned network requests. Network requests may be invisible to users, but they are silent performance killers – especially for users with poor connectivity. Our team discovered several optimizations that delivered significant DAU wins:
Speed up requests
We collaborated with backend teams to reduce latency. This involved improving multi-region routing for some endpoints (bringing data closer to users globally) and optimizing backend parallelism to handle requests more efficiently.
Minimize blocking requests
Stalling the UI waiting for a network response severely degrades performance. We audited our network connectivity to reduce blocking calls, prioritizing cached data as fallbacks and proactively prefetching key resources (e.g. the next lesson).
Case Study: Our app previously made a blocking request to check for site availability on startup. In regions like India, this simple check took over a second. By making it non-blocking, we reduced startup time by 15%.
Manage non-blocking requests strategically
Though seemingly innocent, non-blocking requests can secretly damage performance by consuming computation power and creating network contentions.
Case study: During session start, our app sends non-blocking requests to refresh leaderboards and quest progress. By delaying these non-critical requests by 5 seconds to reduce contention, we significantly improved session start latency and DAUs.
Add offline support
While lessons are already available offline, we added offline support for some gamified features, including daily quests and friends quests, by storing progress on disk and syncing when connectivity returns.
Focus on perceived latency, not just actual latency
Ever stood at an elevator repeatedly pressing the "close door" button? That button often does nothing, but it makes waiting feel better. Similarly, when our apps must perform unavoidable blocking operations, shifting focus to the user's perception of time – rather than the actual processing time – can deliver exceptional ROI.
Case study: improving session end experience
On session end, we make a blocking call to submit session data and fetch all session end screens to display (e.g. ads, rewards, etc.). Initially, we just showed a full-screen loading indicator while waiting. It was frustrating.
Then came our "aha" moment: The first thing we always show after the loading indicator is the "Session Complete" screen. What if we show that immediately while doing the heavy lifting behind the scenes?
So we implemented exactly that. Now, when the learner taps "continue", they immediately see fireworks, celebratory animations, and "Session Complete!" messaging—all while our app quietly submits data and prepares the next screens.
The results were dramatic: 60%+ reduction in perceived session end latency and significant increase in DAUs and total sessions completed.
Before vs. after
Our accomplishments
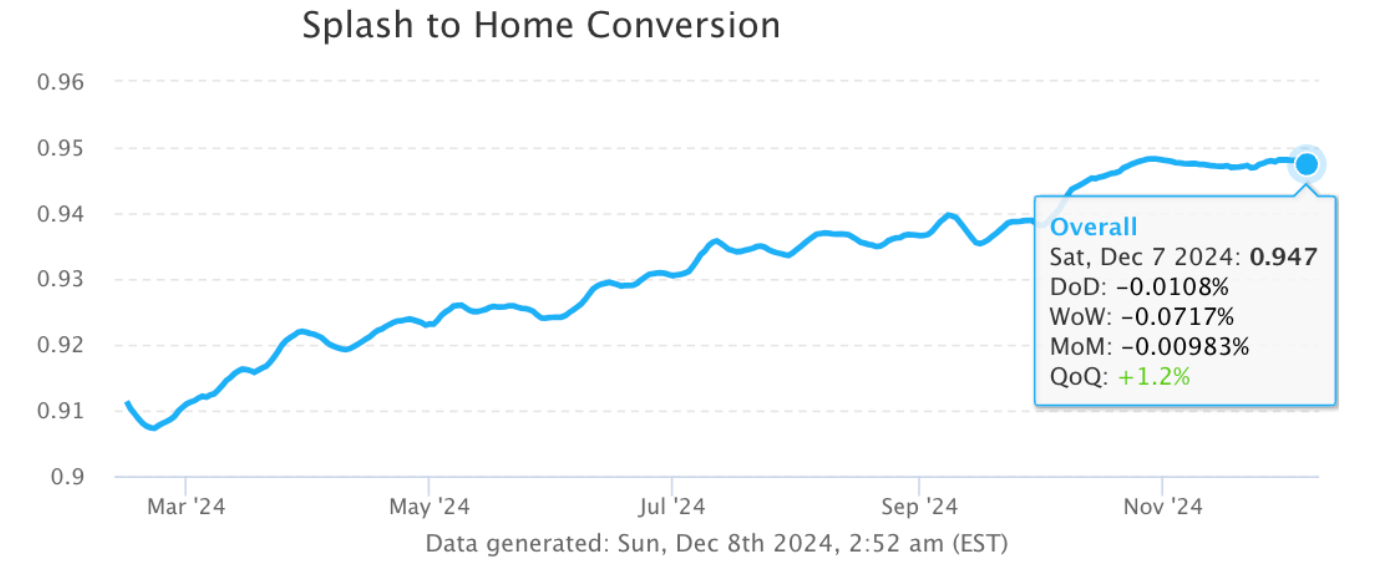
In 2024, the team ran 200+ A/B tests on Android performance and delivered remarkable results:
- Entry-level device app open conversion jumped from 91% to 94.7%
- Entry-level device users experiencing 5+ second app open latency dropped from 39% to just 8%
- Hundreds of thousands of DAU gains were directly attributable to these performance enhancements
This success story involved a symphony of expertise: Product Managers and Data Scientists established clear, measurable objectives; Engineers took ownership of ideation and technical implementation; Technical Program Management provided the crucial connective tissue, ensuring alignment across teams and stakeholders. By bringing together diverse perspectives around the shared goal of performance excellence, we transformed the experience for our most vulnerable users.
Join the conversation
Our journey to optimize Android performance is an ongoing commitment. We've shared some of the strategies that have been most impactful for us at Duolingo, but we recognize there's always more to learn and discover. If you're tackling similar performance challenges, or if you have innovative strategies and insights we didn't cover, we'd love to hear from you. Let's learn from each other and collectively raise the bar for Android app excellence!
If you're an engineer excited about solving problems in order to make education more accessible to millions (especially on entry-level devices), we’re hiring!