
At Duolingo, we are always trying to improve the experience of our learners, and in order to do so, we need to understand how they are learning with the app. To assist with this goal, we are constantly developing new in-house tools that help us identify ways we can improve Duolingo.
Recently, we have added two new tools to our internal analytics dashboard: cohorting and correlation analysis. Because learners come to Duolingo from such diverse backgrounds and with varying goals, we implemented a new cohorting feature that lets us break down data based on different groups of users. To further explore what works best for these different groups, we also created a correlation tool to identify what features and content contribute to a more enjoyable and effective learning experience.
To illustrate how we use these tools, let us take a closer look at a rapidly growing cohort: users of Duolingo Stories. In Duolingo Stories lessons, learners engage with short stories in their target language (Spanish, French, German, and Portuguese for now). With the new cohorting feature, we can now save a group of people who have tried Duolingo Stories in the past several months by specifying all users that have completed a story from May 2019 to present and creating a cohort.
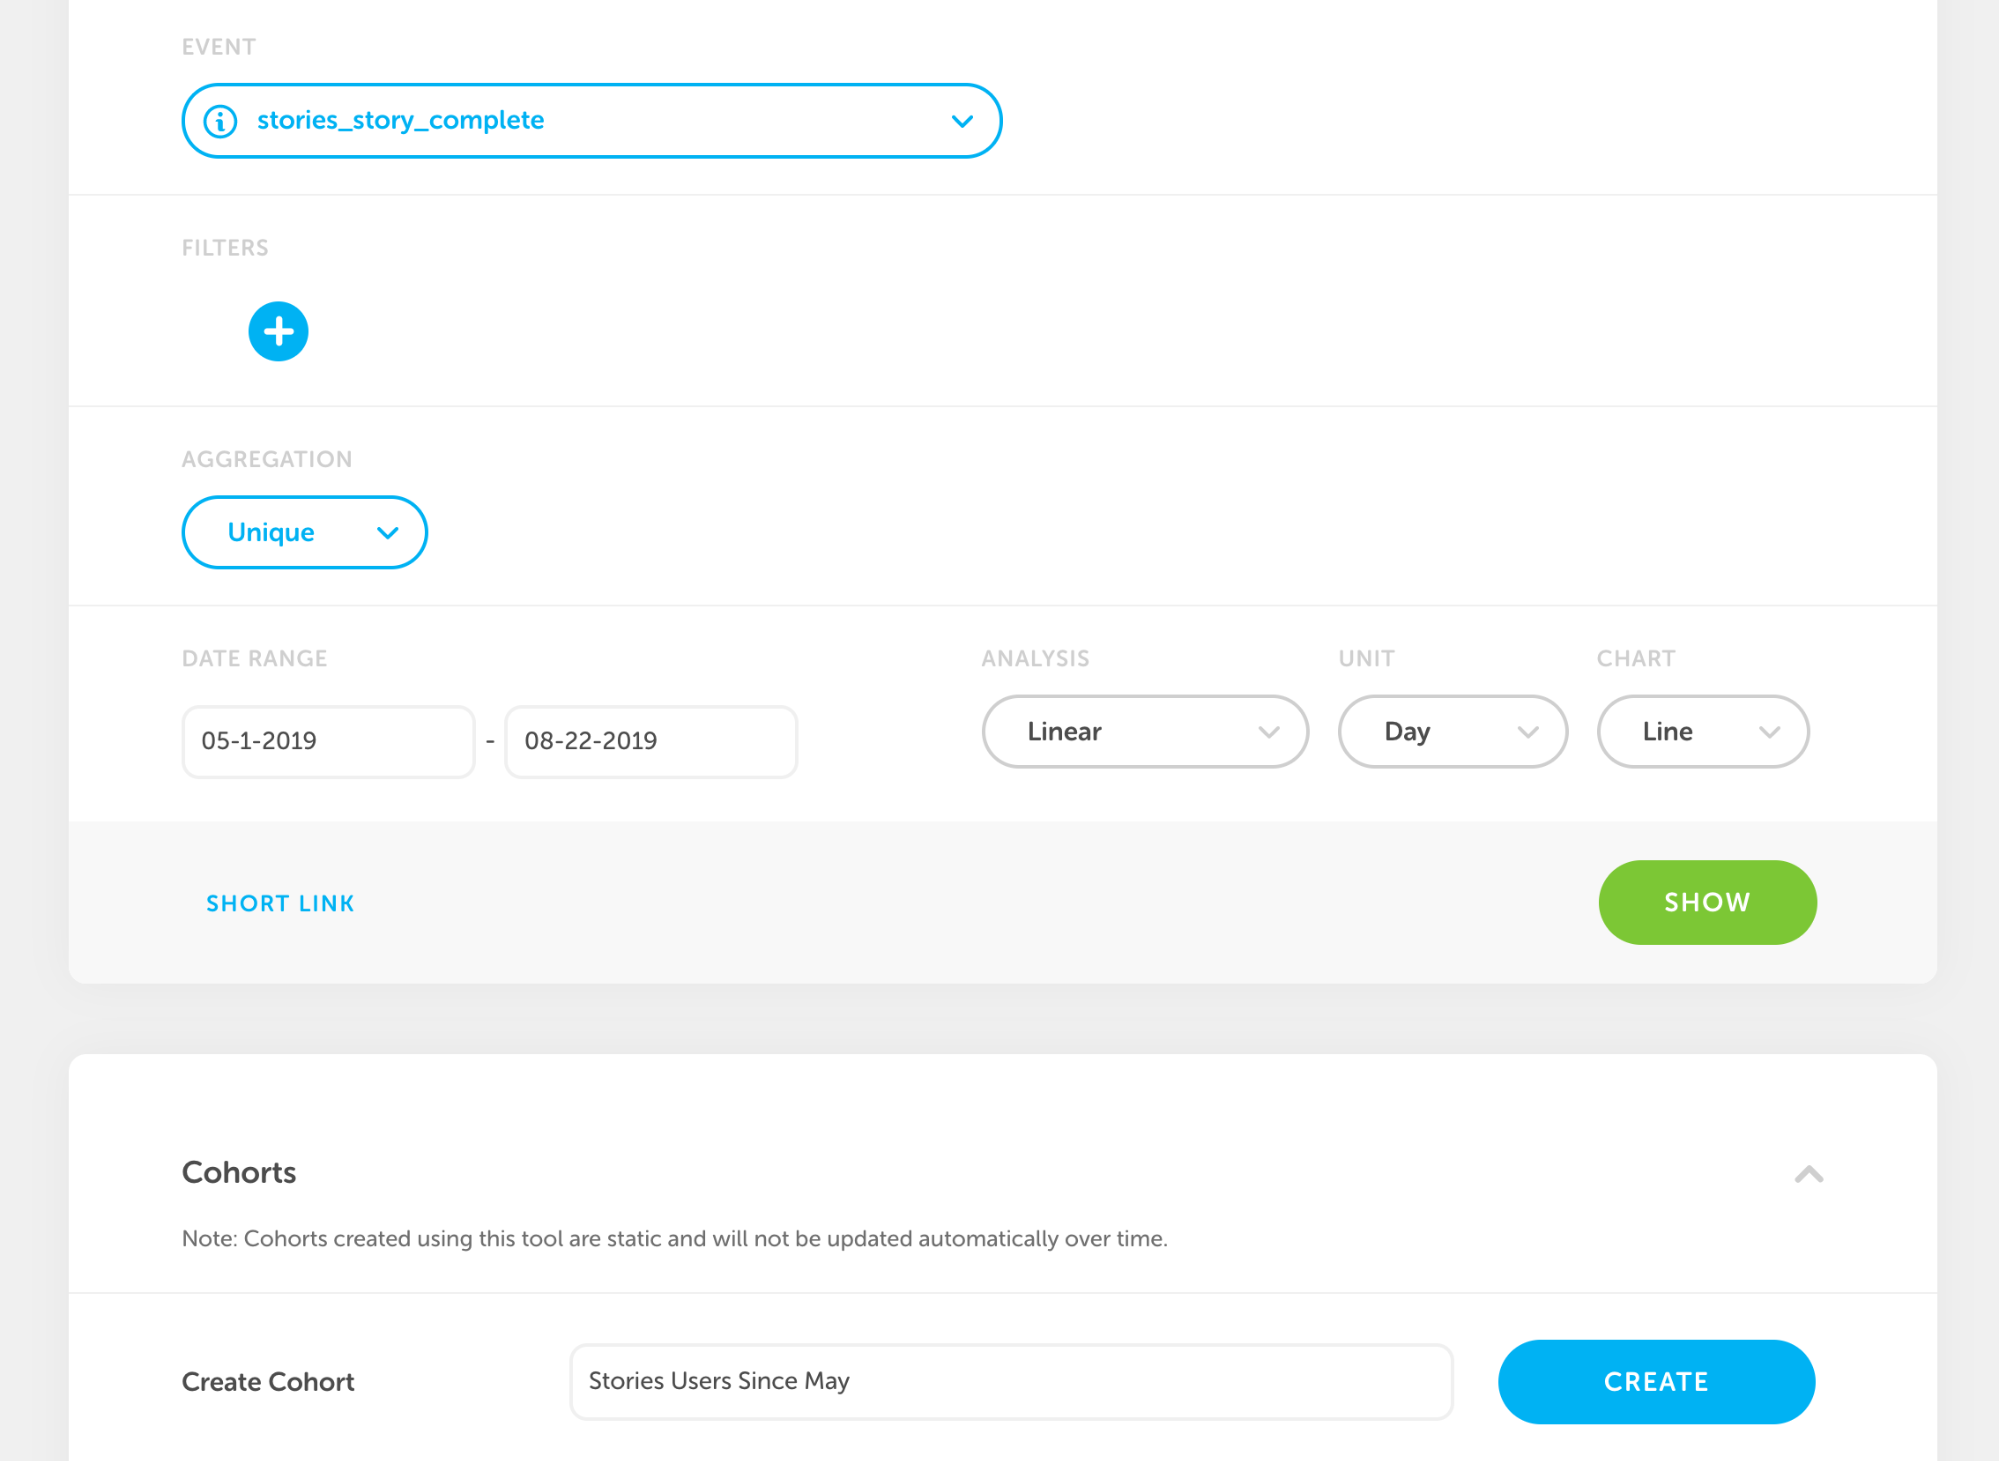
Now that we have a cohort, we can look at how this cohort compares to the average learner in terms of usage as measured by streak.
And guess what? Stories users, on average, have streaks that are seven days longer. Maybe the most committed Duolingo learners are the ones who decided to try Stories!
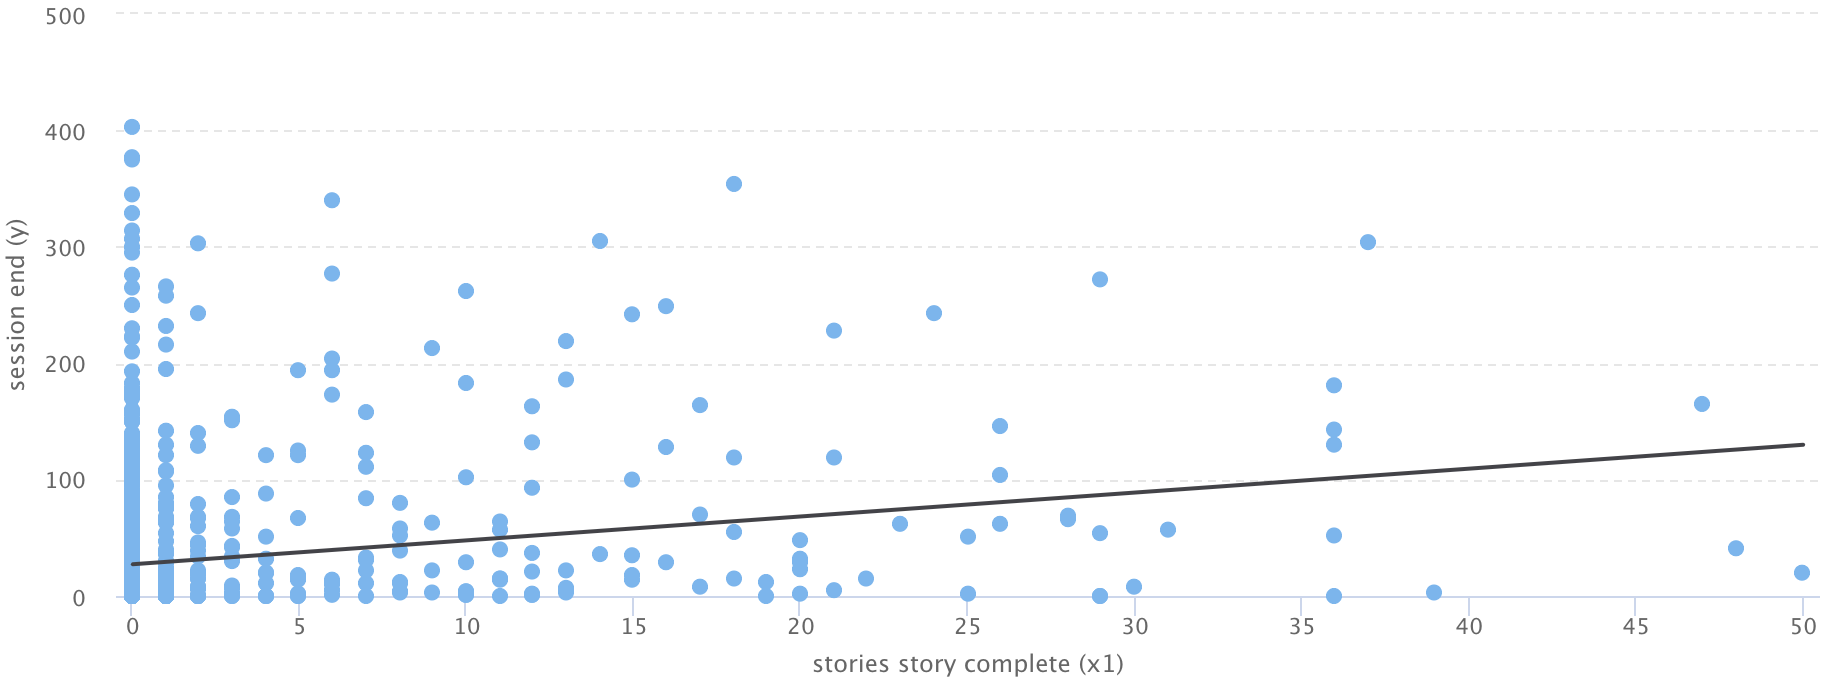
Now that we understand more about the learning practices of Stories users, we can determine if they are staying engaged in Stories and on Duolingo. Using the new Correlation tool, we can make sure that users who do more stories in their first week subsequently do more stories in their second week.

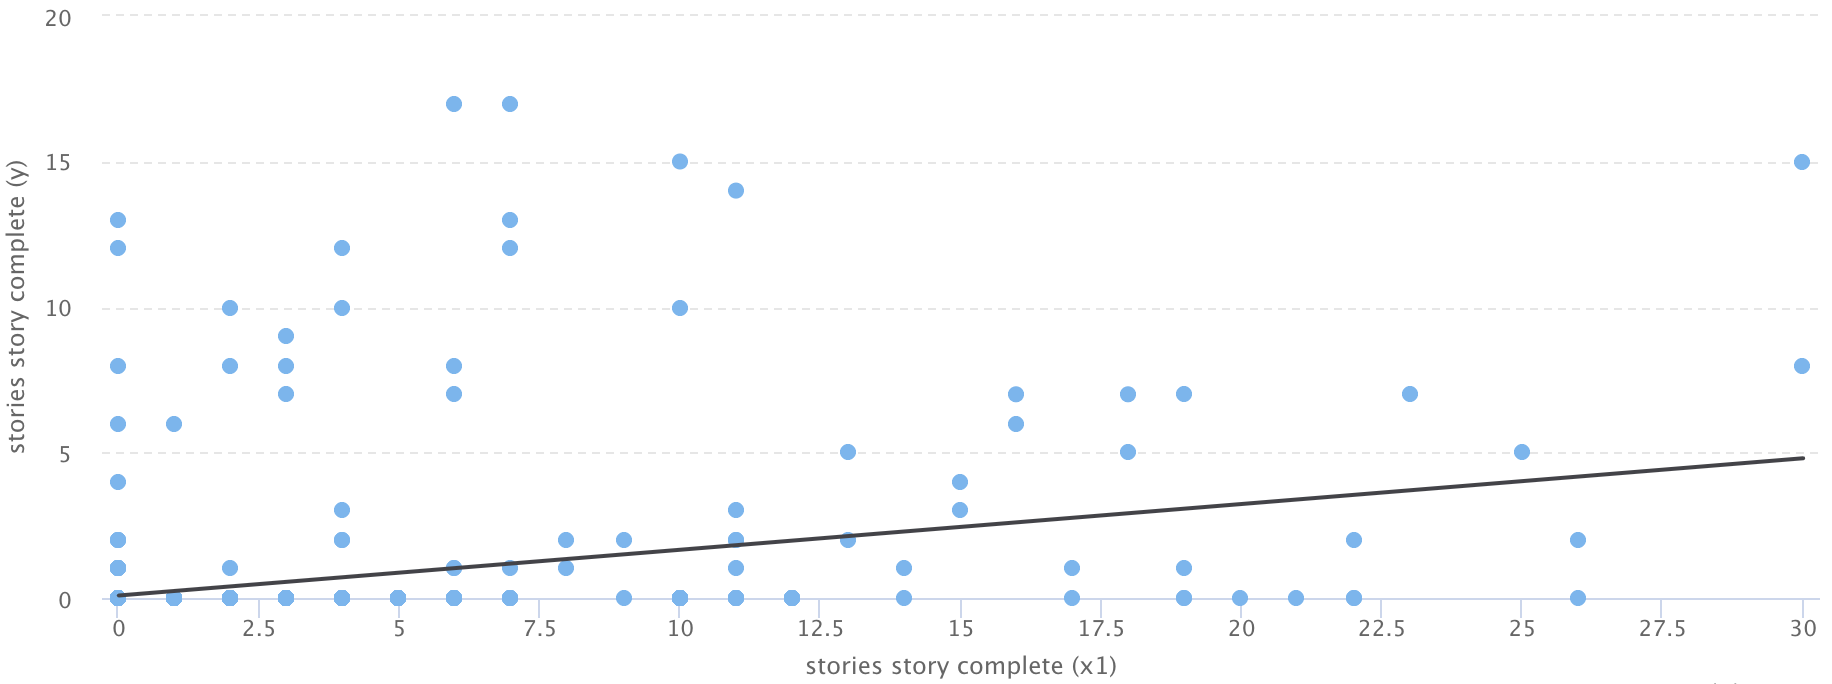
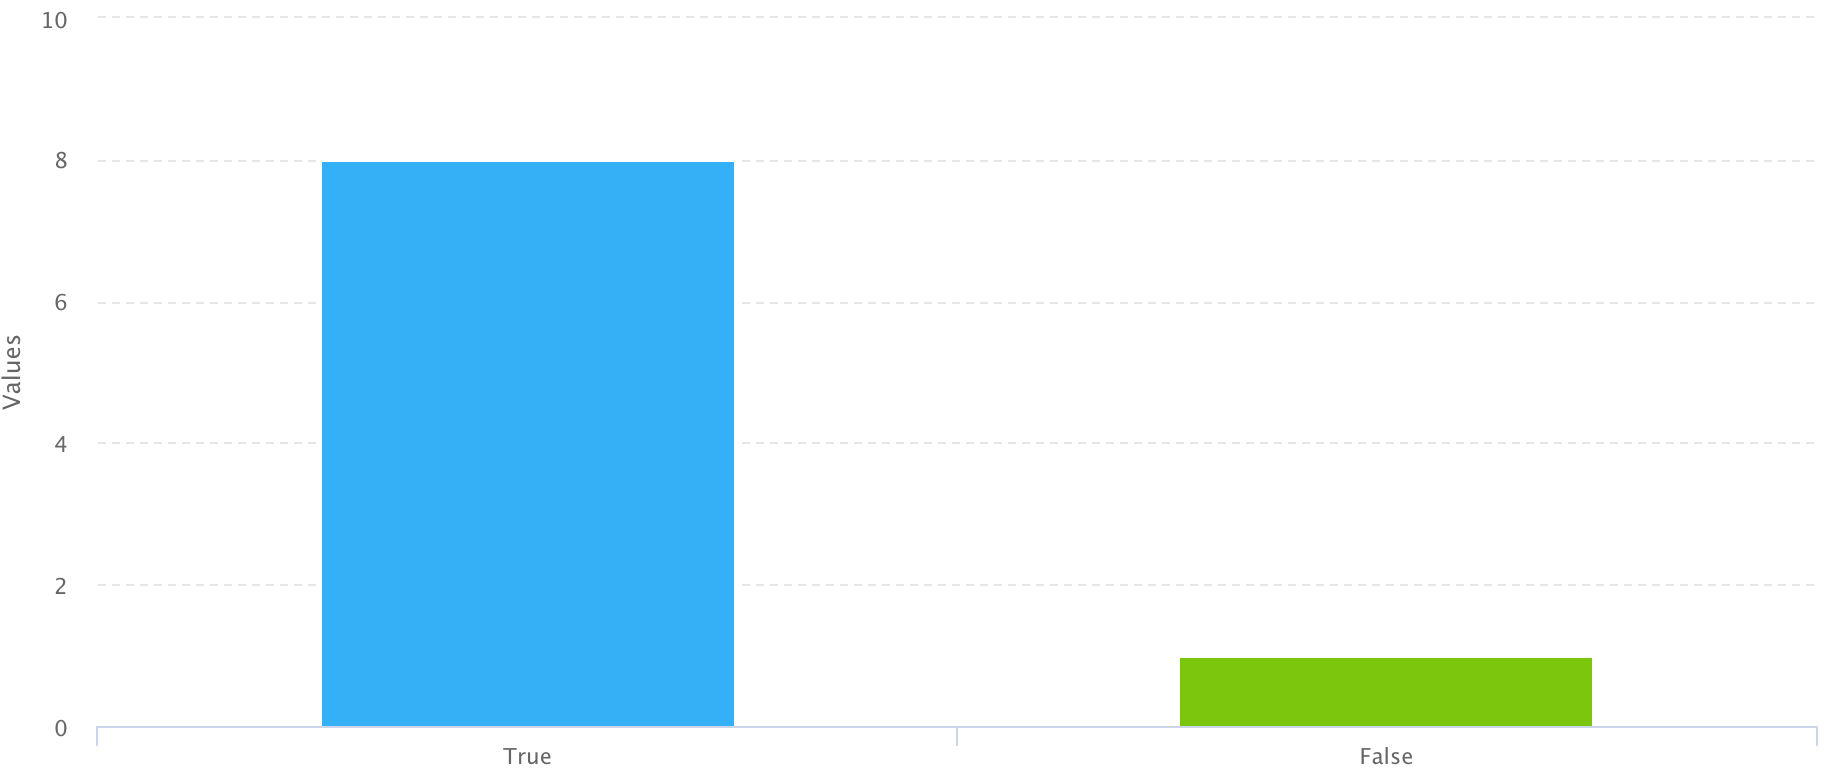
When analyzing this, we saw a significant positive correlation and trend in the plot! But are users sticking with Stories over a longer period of time? Is there a specific number of completed stories in a user’s first week that indicate they are more likely to continue with Stories over the course of a month? To find this out, we can ask for the correlation between each number of lessons a user does in their first week and whether or not they use Stories a month later.
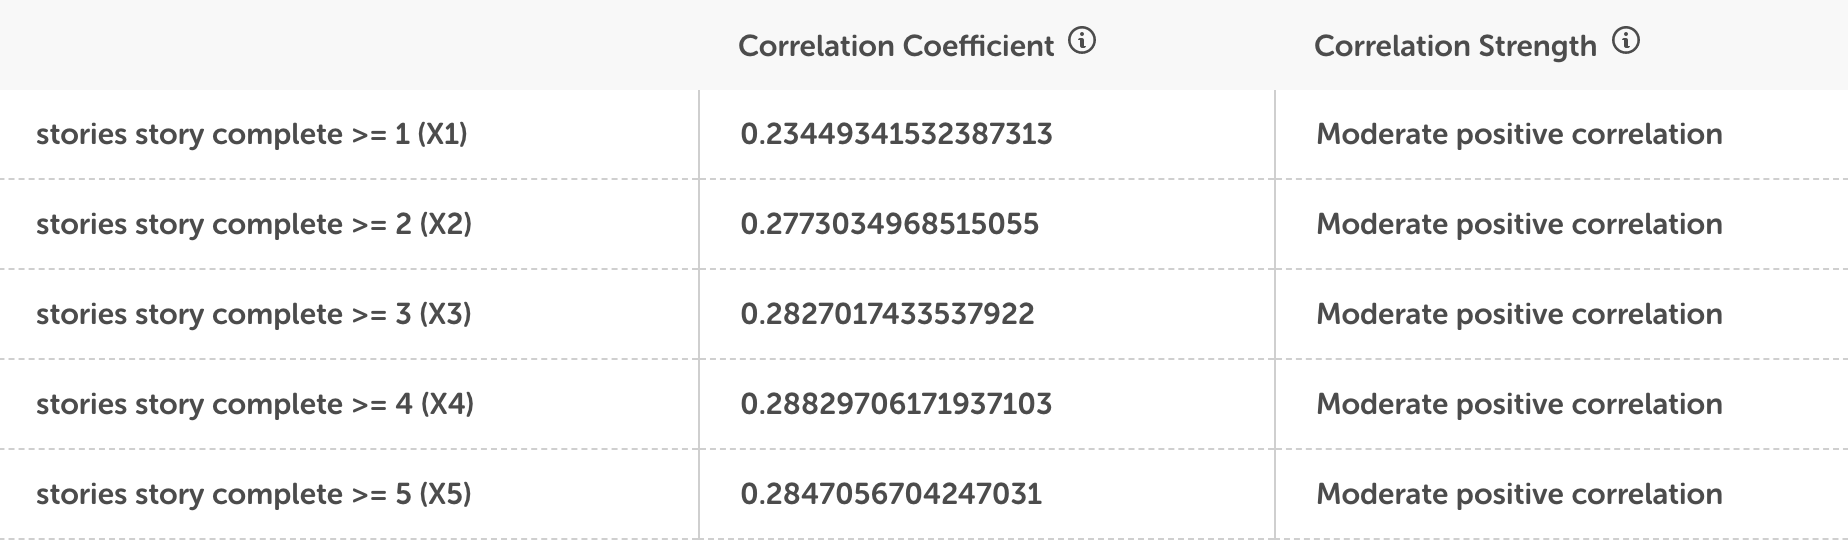
Interestingly, we find that the correlation is maximized when users do at least four stories in their first week. While this is an interesting indicator, we have to remember that correlation is not causation, so doing four stories does not necessarily mean a user is more likely to continue. Nevertheless, having made this finding, we now have the option to conduct a more thorough analysis of this relationship.
Finally, we did one last check to ensure that Stories are not supplanting regular lessons by finding the correlation between the two. As it turns out, Stories users are also doing regular lessons, too!

While being able to verify our hopes and expectations using these tools is valuable, these tools are equally important – if not more important – for checking and correcting our misconceptions about what makes the app better. There may be times when we think adding a feature will improve learning for users, but it in reality does the opposite.
We hope that through the continued use of tools like cohorting and correlation, we can be more aware of our learners’ needs and give them the best language-learning experience possible!