
And Now for Something Completely Different
As a Mathematics PhD candidate at MIT, many might guess that I spent my summer doing academic research on computational geometry (or something of the sort).
Instead, I jumped at the opportunity to do something completely different with my summer: I accepted an internship at Duolingo, where I took on a pure software engineering project. My goal was to increase the efficiency of a system that stores statistics collected from every Duolingo lesson in order to help us improve the quality of our courses.
Learning How You Learn
Among the statistics we collect from each lesson are: how often learners answer a question correctly, how often they answer correctly without taking any hints, which words they take hints for, and how long the average learner spends completing a lesson.
We then use those statistics in several areas:
-
Whenever you start a Duolingo session, we choose a set of challenges for you that’s balanced for difficulty, covers all of the words you need to know, and offers a variety of challenge types.
-
When you choose to take a placement test for a language you’re just starting on Duolingo, we try to use challenges of consistent difficulties, although they may test for more or less advanced skills. For this, we need to know how difficult the challenges are for learners.
-
In developing a language course, we need to know how difficult each challenge is to determine which areas the course need improving.
The system we previously used to store those statistics was adequate when Duolingo first started, but as we’ve grown, it’s gotten expensive: as of May, we were paying $60,000 per year for the database alone. It takes a lot of Duolingo Plus subscriptions to pay for that! Unfortunately, changing the system was easier said than done because it’s been a big part of Duolingo’s core mass of code. As a result, deploying any change to it required deploying a new version of almost everything.
So, how did I – a mathematics PhD student with no background in software engineering – go about tackling something so unfamiliar at Duolingo?
Day-Old Data
I started the project practically, with a description of the problem, some suggestions for tools I might use to improve it, and a mentor I could (and did) poke if I got stuck. I spent my first couple of weeks deciding how a new system for storing challenge statistics should work, my next few weeks building a new system outside of the core mass of code that could still do everything the old way, and another few weeks optimizing the system.
Challenge statistics are now stored in a specialized service separate from the core code, allowing the team to modify it independently. This is a vast improvement from the previous database, which was slow and expensive because it provided up-to-the-minute accurate data – meaning that if you finished a session, the statistics from that lesson would be used to build your next session. But, as we found, day-old data is almost as good as up-to-the-minute data. Because many requests for challenge statistics are repeated multiple times per minute, the service now stores answers to requests over the course of one day in a special cache, which saves a lot of time spent calculating and accessing the slower database (see Fig 1).
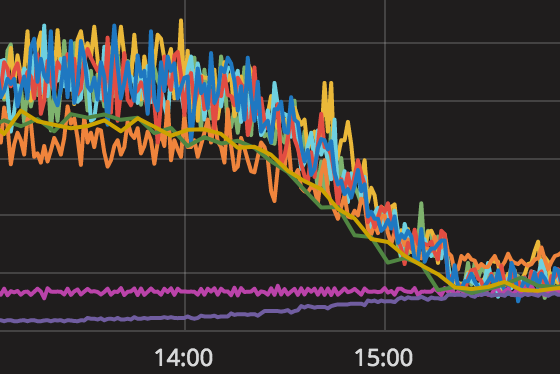
Each of the ten colored lines in Figure 1 represents one copy of the database, and the height represents the amount of processor power the database uses. The bottom purple line represents the database used by the service I created this summer. Over the two hours when we gradually moved traffic to the new service, database usage decreased by a factor of 5.
See the Change
After implementing the new system, we quickly found that it is 20 times faster, on average, at responding to query requests than the old one (see Fig. 2).
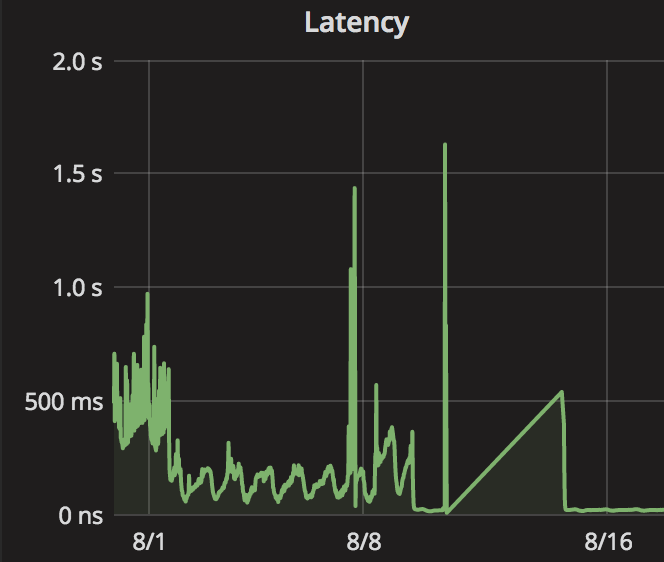
The graph in Fig. 2, in fact, tells a large part of the story of my internship: at the end of July (at left), the service I created worked the same way as the old service, and took an average of half a second to respond to each query, with fluctuation over the course of a day as our number of users fluctuates. At the start of August, I started caching query answers for a day, and average response times went down to one or two tenths of a second, again varying throughout the day.
As you can see in Fig. 2, at the end of the first week of August, I implemented a change that accidentally broke the service. Over the next three days, I experimented with several changes: some of which helped; some of which brought down response times down further, to 20 milliseconds; and one which broke the service again. When that happened, I shut the service down (reverting to the old mass of code) for the weekend. Then the next Monday, I made another set of fixes and restarted the service, and the first queries as the service warmed up took just over half a second to respond to (that straight diagonal line in Fig. 2 isn’t real data, just interpolation). Once it warmed up, the average response time returned to 20ms, where it’s been ever since.
Keep the Change
As a user, the response times you see won’t have changed much, since getting challenge statistics is a small part of the time it takes to, say, construct a lesson. But it’s there.
And importantly, we now spend $53 per day on the service, cache, database, and supporting infrastructure combined, compared to $163 per day for the old database alone. This means Duolingo saves a total of more than $40,000 per year – not bad for an internship project!