Duolingo works to improve the performance of our apps for all of our learners. As Duolingo has grown over time with new courses, features, and millions of additional users, several teams are working behind the scenes to keep things running smoothly. This post will focus on a backend feature called Request Tracing that has led to significant improvements in performance.
Duolingo is steadily moving from a monolithic architecture (a few large, tightly-coupled services) to a microservice architecture (many small, loosely-coupled services). This has its advantages, but also has tradeoffs, including operational complexity and observability.
For example, with an isolated service, it's straightforward to log its requests and do some simple profiling to find out what calls are doing. But how do you get that observability when many services interact together, as is the case with microservice architecture? To that end, we've recently added request tracing at Duolingo, which has given us observability and insights into our services.
The results and highlights of this initiative have been promising:
- 10% reduction in Duolingo's latency, in the first weeks of testing!
- Substantial error, latency, cost, and infrastructure reductions across the stack
- Cool pictures (see below!)
Sampled Request Tracing with Jaeger
 Jaeger is a wonderful open-source request tracing tool that we began using in 2019. There are a plethora of request tracers, but we chose Jaeger as having the best compatibility and support for our stack (mostly Python and JVM services).
Tools like Jaeger are usually configured to trace a small sample of requests. This avoids the need for heavy infrastructure to analyze, report, and store all traces, and a potential performance hit on the services being traced.
In early testing, we discovered an inefficiency in our largest legacy service. A very common internal method was querying Dynamo multiple times for essentially the same data, rather than caching. Although reasonable when first added, over years this pattern had grown less efficient: it queried more data, and was called more and more often.
Caching this resulted in a 10% reduction in Duolingo's overall latency, and a substantial cost reduction as well. This was a good sign that request tracing would be useful!
Always-On Tracing
Sampled tracing is extremely useful for some problems, but not all. Reproducing a rare bug or a specific user's issue are still difficult tasks, as the traces often aren't available. Ideally we want to trace every request, without requiring expensive infrastructure or incurring slowdowns in our applications.
It turned out that in a limited sense, we were already doing this!
Amazon Web Services (AWS) has a request tracing feature powered by the "X-Amzn-Trace-Id" header field; this is generally only used by AWS X-Ray (another sampled tracer). By turning on access logging, we had access to the feature, but weren't using it.
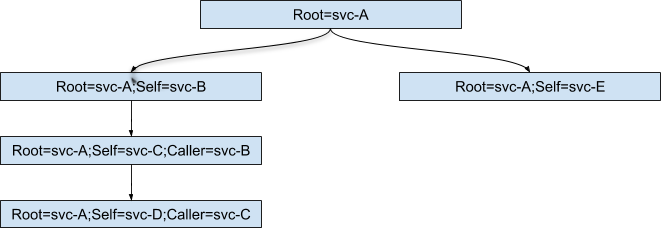
However, this feature supports arbitrary fields. If we could propagate the header and add a "Caller" field (see below), we could derive a call stack for any request!
It was relatively straightforward to propagate this custom header through our microservices. Parsing and stitching together the various application log entries was accomplished via AWS Athena and Python. Much of this work was done by Ruidong Liu as a Duolingo internship project.
Traces, Traces Everywhere…
Processing all of the linked data on every request would be unnecessarily expensive, but is very valuable when used judiciously (on-demand). Here are a few of the on-demand applications we've found:
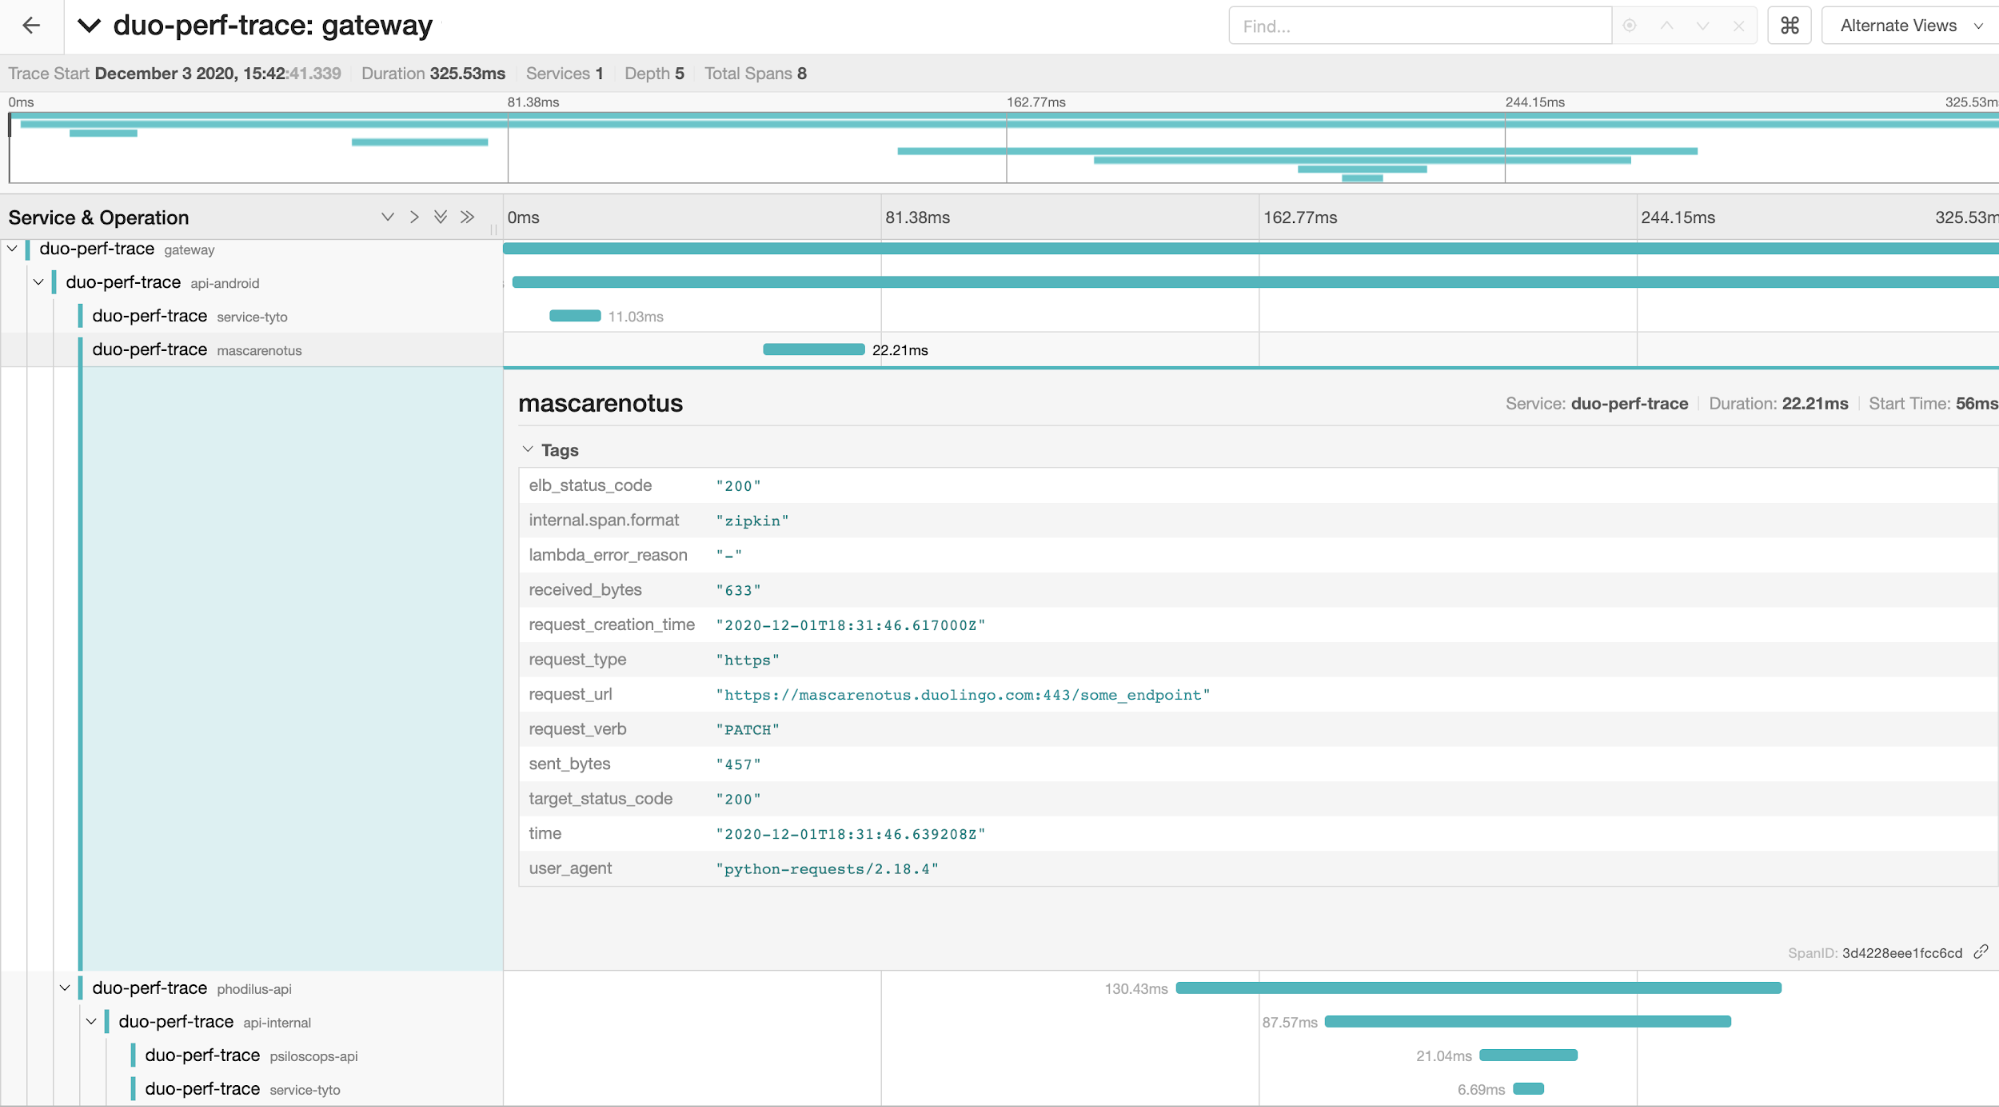
- Tracing for a specific request. The original request ID can be found via AWS ELB logs, but often that's difficult for a developer to find. However, since it's generated via a header with custom fields, it can also be output in exception data (reported from error alerting services), or cross-referenced with metadata such as user ID. The generated data can then be easily visualized, in our case with the Jaeger UI:
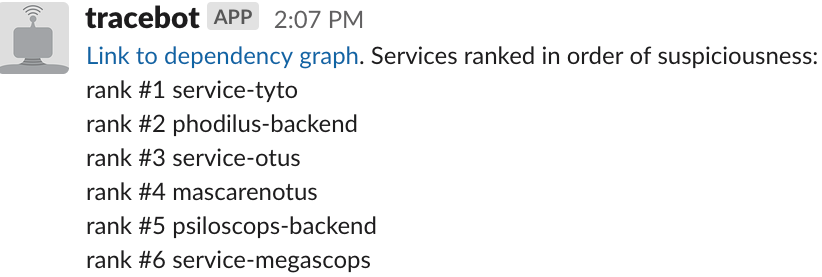
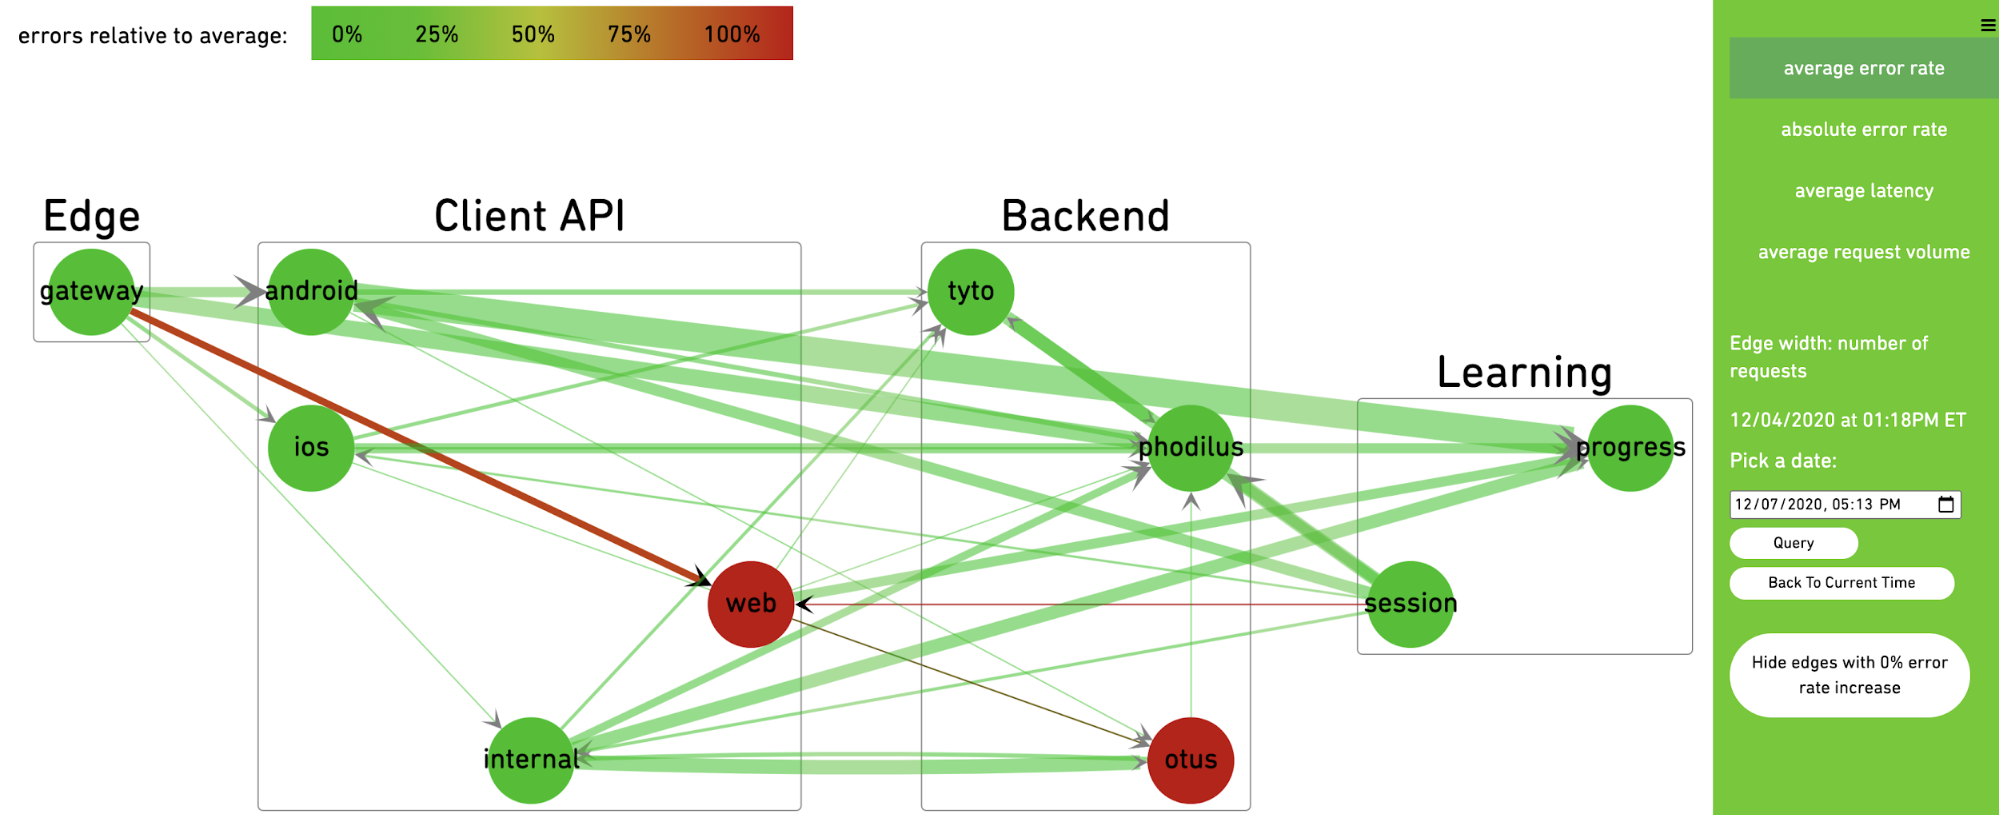
- Latency and error investigations, e.g., "what service is causing the slowdown that started at 1:13 pm?" By parsing high-latency or failing calls and comparing to a snapshot of usual behavior, we can find suspicious services. We then use a ranking algorithm such as PageRank to find the most likely services:
- Visualizing service dependencies and filtering by traffic, request and response size, or other metadata. This can lead to surprising insights such as finding uncompressed responses, repeated errors, or latency between microservices.
Future Work
Exciting work is being done in the Observability and Tracing spaces! In particular, we're planning to adopt the upcoming OpenTelemetry standard, which is also supported by many vendors including AWS. Grafana Tempo is similar to Always-On tracing (developed contemporaneously); it's not only a validation of our approach, but potentially a way to unify and standardize our infrastructure for the feature.
Interested in software engineering at Duolingo? We’re hiring for full-time and intern roles!