
While Duolingo has sent Year-in-Review emails in the past, 2020 was the first year where we combined efforts from the product and marketing teams to integrate the Year-in-Review into our app. Read on to see the results!
Why did Duolingo decide to do a Year-in-Review?
Throughout 2020, we heard from learners worldwide that Duolingo brought them a sense of normalcy, productivity, and purpose. Seeing inspiring messages from Duolingo learners who made the most of their quarantines with language learning really brightened our year, too. We wanted to celebrate these learners and make them feel proud of all they accomplished.
How did you decide who would get a Year-in-Review report?
We focused on learners who had enough activity that their report would feel exciting, but not so much that we would alienate some of our more casual learners.
A lot of us began quarantine thinking we’d use our time wisely by learning a language or doing more yoga, but it’s safe to say many of us ended up putting those healthier hobbies aside to binge Tiger King. With that in mind, we decided all learners who were active for at least 7 days and completed 20 or more lessons would receive a personalized Year-in-Review.
Because this was our first time including a Year-in-Review in the app, we wanted to get the group of eligible learners together far in advance to prepare all the stats and personalized reports. This meant including learners who met the above activity criteria by October 31, 2020 so that we could get to work.
How did you decide which stats to feature?
First, Duolingo engineers and marketing folks had a brainstorm where we listed all the learning stats we thought would be interesting. Some stats like the number of words reviewed were possible to include, but others that change when we update courses or add features were not. So we had to make tough decisions—like omitting learners’ streaks and percentage of the course completed—in order to avoid confusion over inaccurate information.
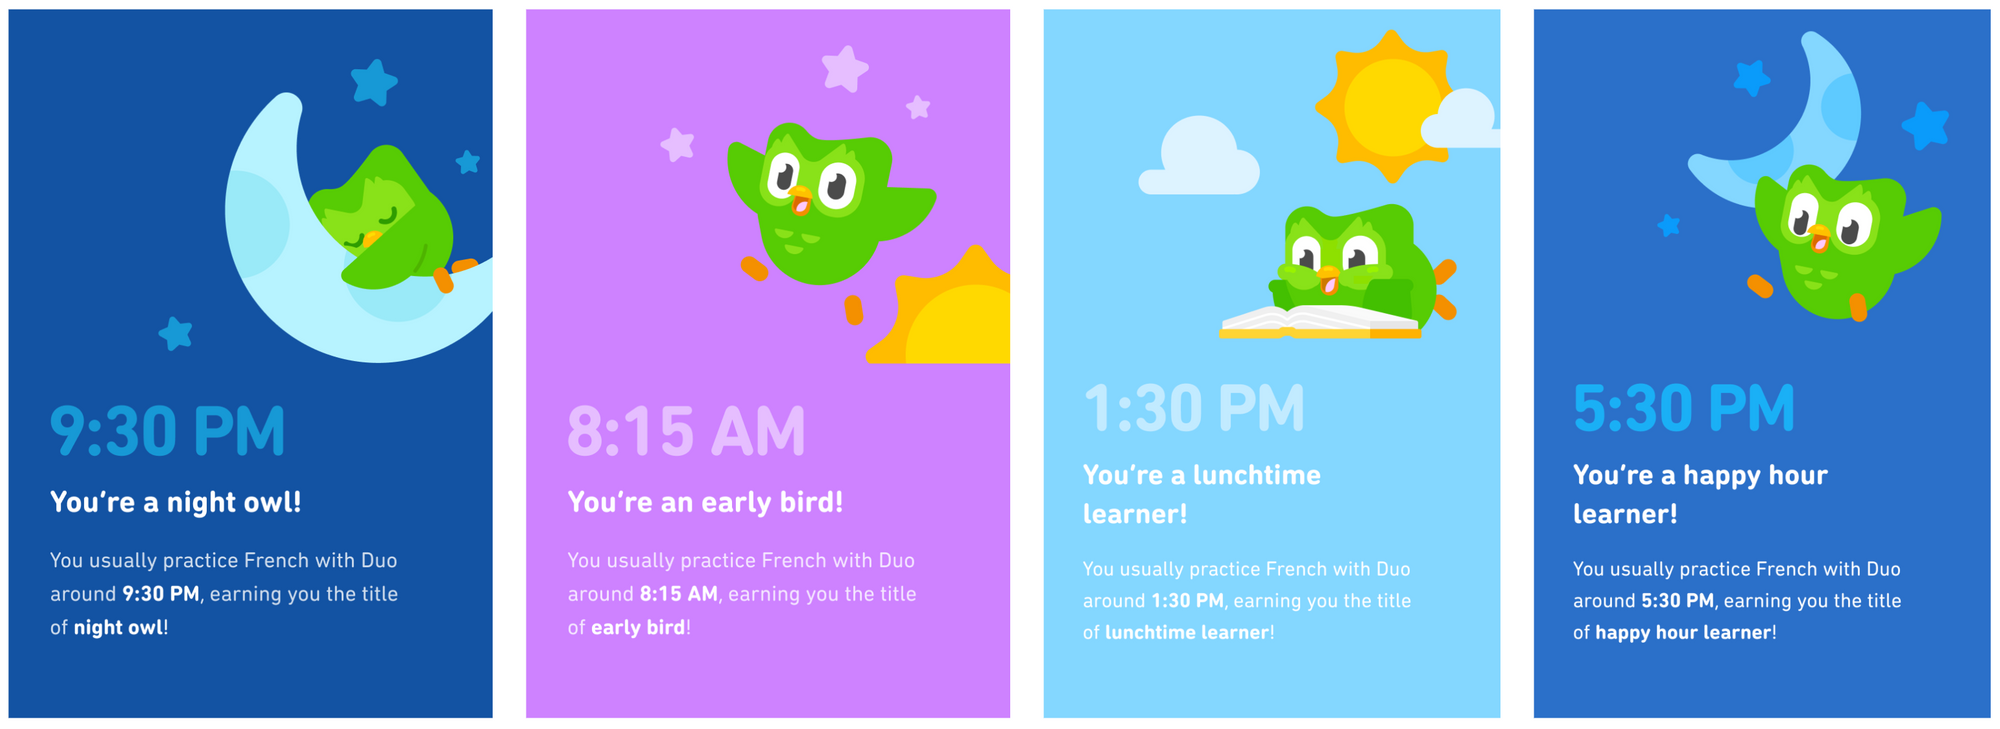
Once we had a list of everything that was possible from an engineering perspective, we picked the most compelling stats to feature.
How did you make learners’ achievements shareable?
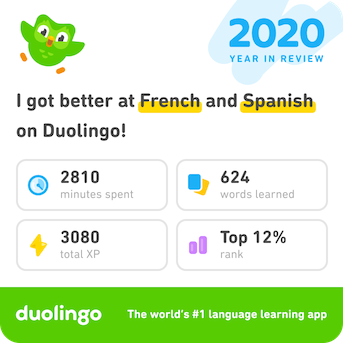
We wanted to give learners an easy way to share their year of Duolingo progress with friends and family. There were several options that we considered, including sharing the website link directly, showing a truncated website when you share, and creating a shareable “card” of the main stats. We ultimately felt that condensing your Duolingo stats on a shareable card that worked like an image would be the most efficient. This allowed both the learner and their friends to view the most important stats without having to scroll through the entire webpage.
What was the biggest challenge you faced creating this project?
Year-in-Review was a multi-team effort that involved teams working in both Beijing and Pittsburgh. The effort to ensure that everyone stayed on the same page across time zones was quite challenging. We had a weekly meeting that was late at night for one office and early in the morning for another.
In addition, calculating the stats for all of Duolingo’s learners in the past year was not a trivial task and took significant computational resources. We had to set a cutoff date of October 31st to make sure that we had a month of time to design, calculate, and test the page before it launched in the beginning of December.
What stats did people find interesting and like to share the most?
People loved to share their relative ranking compared with other learners. Comparing with others gave a better sense of how well they performed and competing with global language learners also motivated people to brag about the results. It’s very interesting to see a lot of learners share their ranking on social media:
“There weren’t many positives to 2020, but 5 mins a day at least meant my Japanese has improved! Top 6%!”
— Paul Swaddle (@paul_swaddle)
“Top 1%! I’ll take that - Tapadh leibh”
— Laura McPeace (@Lauramcn1)
What were some different behaviors across countries?
Year-in-Review was launched globally, and we’ve seen very different behaviors across countries.
Japan had the highest view rate and email open rate, while having the lowest share rate. This is most likely due to more of a cultural reason. Sho, our Japan Country Marketing Manager, said “I’m a bit shy to share because it’s not like I put a lot of effort (time and XP).”
India and Brazil had below average open rates, yet had the highest sharing rates. Ana, our Brazil Country Marketing Manager, pointed out that “Brazilians are proud of themselves when it comes to learning a language so they really feel like sharing their achievements.”
What were some things you wanted to do but weren’t able to?
We wanted the microsite to be more interactive, where learners could play around and customize results based on their behaviors. For example, we could’ve had learners select which languages they plan to learn and generate a 2021 New Year Resolution page at the end of the report. We also wanted to provide more diverse comparison stats like ranking the number of languages they’ve learned, time spent, words learned, etc. When we plan the 2021 Year-in-Review, we could consider fleshing out these ideas.
TL;DR
Integrating our Year-in-Review directly into our app was an enormous success. It allowed more learners to see and be proud of their achievements in a difficult year. In the words of one of our learners Jacob Wagoner (@jcwagoner):