
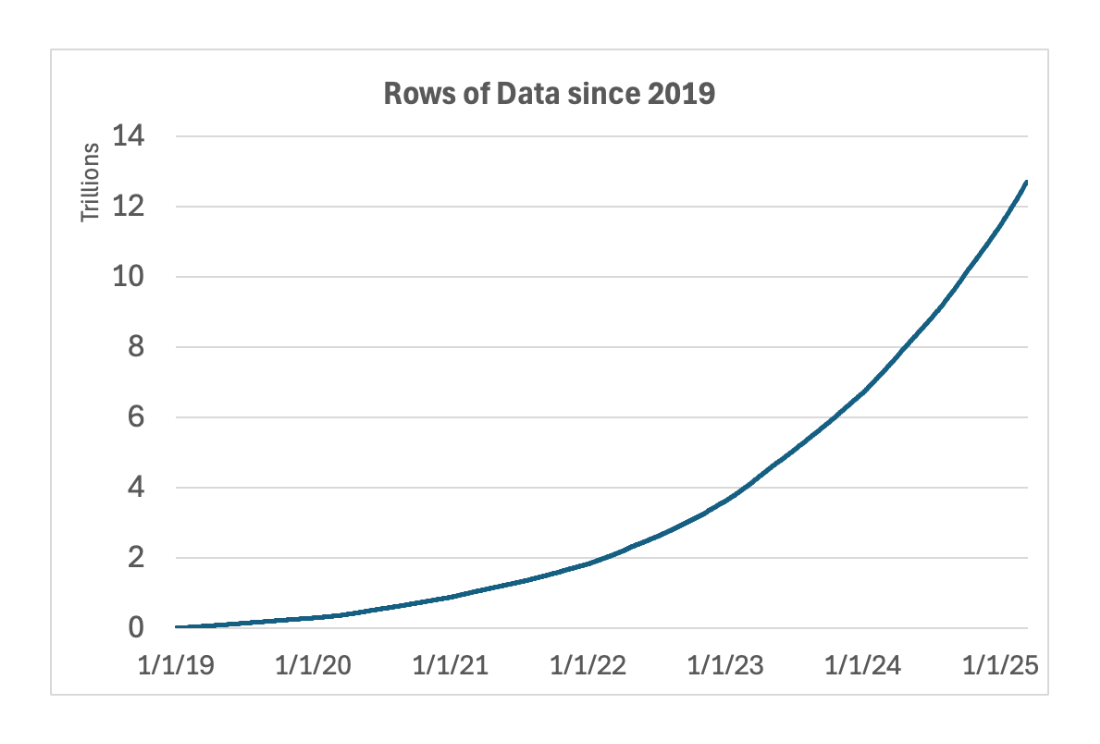
Data is at the heart of everything we do at Duolingo, whether it's iterating on new content through A/B testing, identifying performance bottlenecks in the app, or better understanding how learners interact with the app. We store this data in Google BigQuery, a scalable data warehouse that can store and analyze the more than ten trillion rows of data that we regularly work with.
Using our internal suite of data visualization tools, Duolingo employees (i.e. "Duos") can explore this data interactively, asking questions like, "How many learners completed a French lesson yesterday?" or "In which part of the app do most crashes occur?" Duos often chain multiple queries together, asking follow-ups like "Was there a particular country that saw a spike in French lessons?" or "Which specific version of the app introduced these new crashes?" For this workflow to be effective, data queries need to run quickly, ideally in less than 10 seconds.
As Duolingo grew to serve a worldwide audience of learners, our data volume grew too, nearly doubling every year! With more data, our queries started to get slower, and Duos started having to wait for multiple minutes to get access to the key metrics data they needed.
Throwing more BigQuery resources at the problem would have helped, but we were not excited about the prospect of doubling our BigQuery spending annually. We instead tried to devise an alternative solution: Was there a way we could still support fast, interactive queries at scale without spending a fortune on BigQuery?
Using sampling
The key observation that we made was that, in most cases, exploratory analyses focus on trends and comparisons between segments (e.g., error rates on iOS vs. Android devices) rather than exact numbers. This means that it is often worth it to trade precision for faster or cheaper queries.
With sampling, we query only a subset of the relevant data rather than the entire dataset. For example, if we want to count how many learners did a French lesson, we could efficiently approximate the answer by analyzing 25% of the lessons and then multiplying the result by 4. Since we often want to compute user-oriented metrics (How many lessons does an average user do a day?), we typically do per-user sampling, where rather than choosing 25% of all lessons at random, we instead look at all of the lessons of 25% of users.
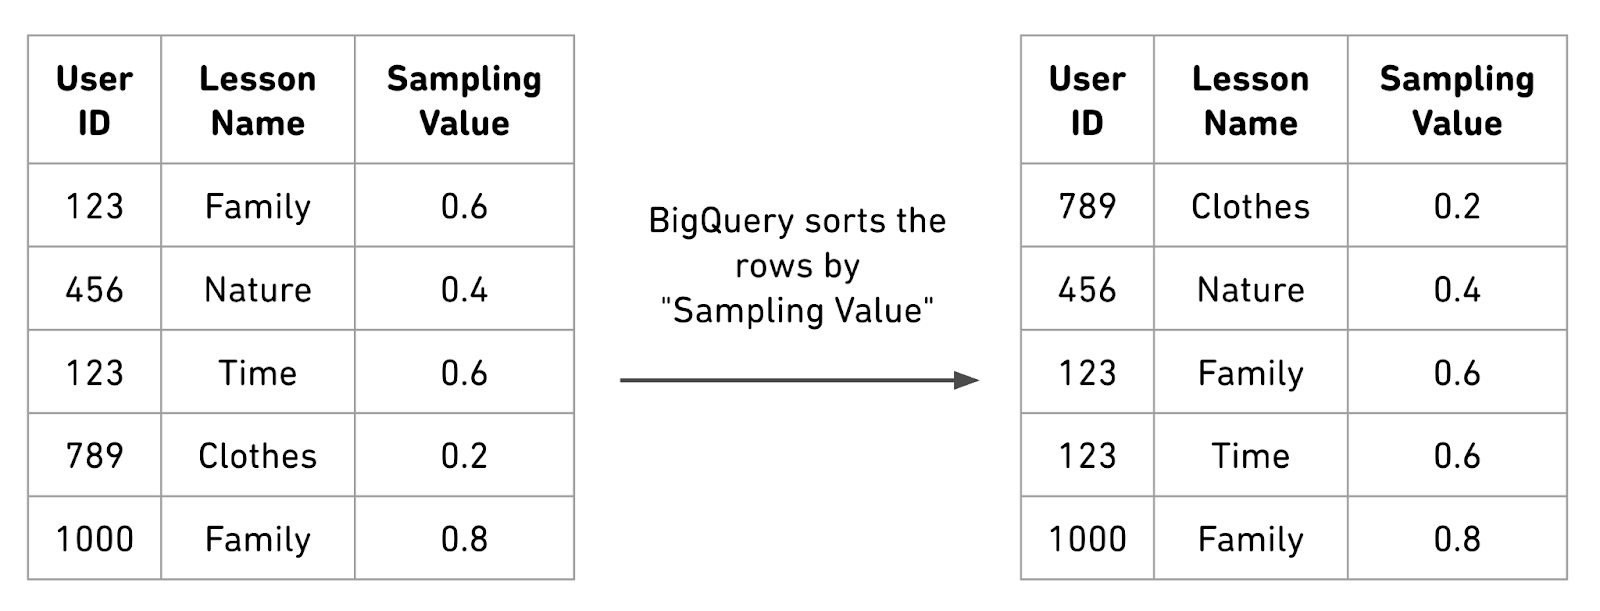
Since we would like our set of sampled users to be consistent, we cannot rely on BigQuery's out-of-the-box feature for sampling, which samples rows randomly. Instead, we lean on a BigQuery concept called clustering, where rows in tables can be sorted by a specific column. For each row, we hash the relevant user_id, then map the result between 0 and 1, which we call the "sampling value," and then cluster (i.e., sort) the table by that value.
Now when we want to query the table with sampling, we filter for a specific sampling value (for example, sampling value < 0.1 for 10% sampling). Because the data is sorted, BigQuery knows exactly where to find the relevant sample and does not need to look at the large remainder of the dataset, making the query incredibly efficient.
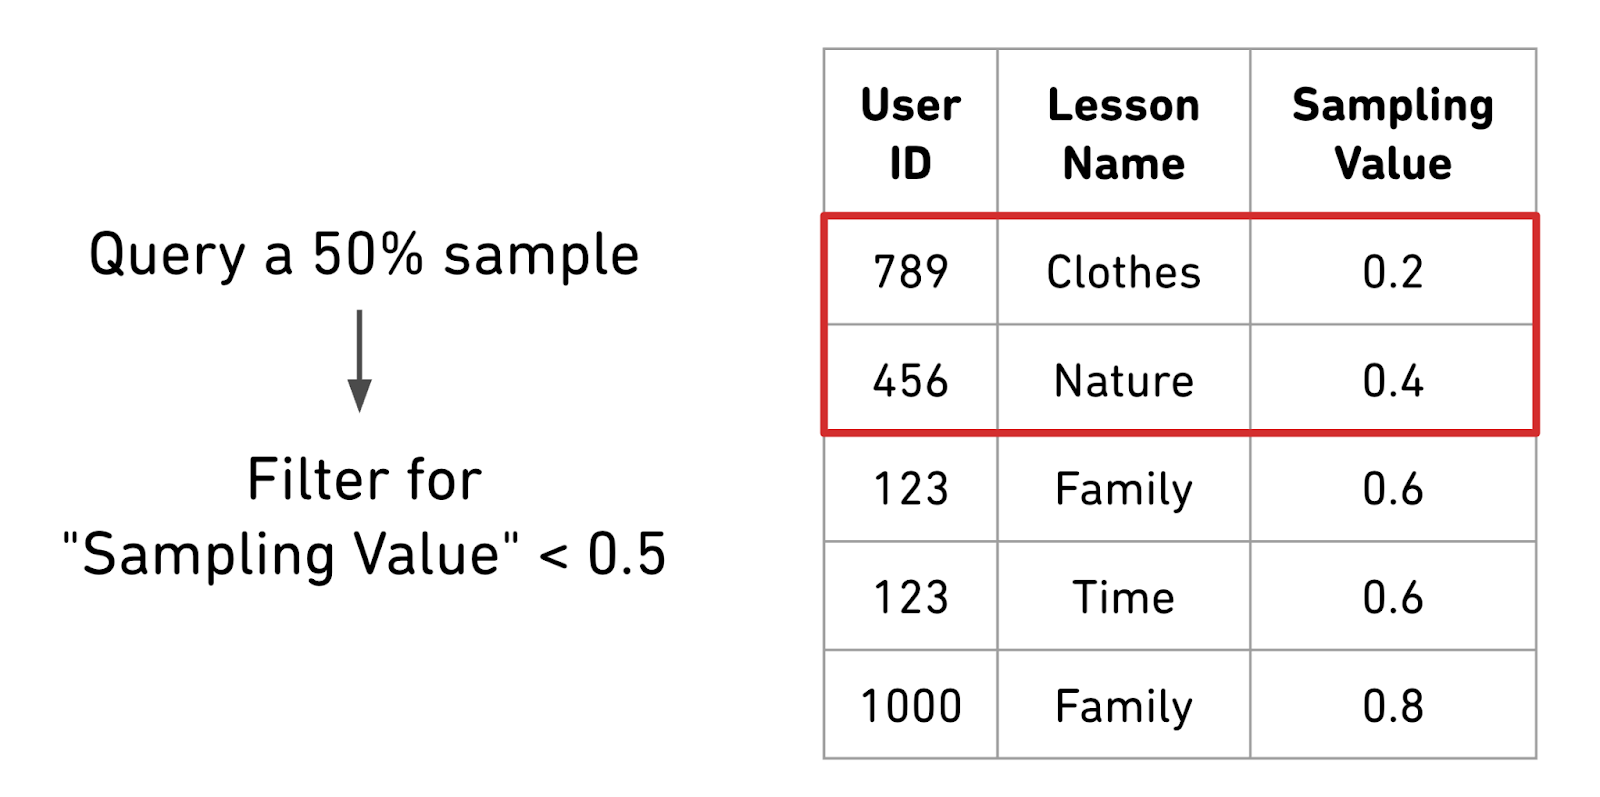
Once the data is sorted by "sampling value," BigQuery can efficiently filter for a sampled subset of users. In this case, to do a 50% sample of users, we filter for "sampling value" < 0.5 and quickly limit our analysis to 2 out of the 4 total users.
Results
In order to evaluate the effectiveness of sampling, we took common queries and ran them with different levels of sampling. The results were dramatic, with a sweet spot around 1% sampling for very large datasets, where queries were as much as 68x faster with an average error of <0.2%.
Performance of Query Analyzing Two Years of Duolingo Lessons
With small datasets, sampling has a more substantial accuracy penalty but is also far less necessary because small datasets are already efficient to query.
Once we saw just how dramatic the improvements from sampling could be for query performance and cost, we began integrating it directly into our analysis tools. Now whenever we perform exploratory analyses, our tools analyze the amount of data that needs to be processed and automatically recommend an appropriate sampling rate that gives the most bang for the buck.
By embracing sampling as a core strategy in our data analysis workflow, we've significantly reduced query costs and improved performance without sacrificing meaningful insights. This approach allows us to continue to scale the data we store while maintaining the speed and interactivity that Duolingo employees rely on.
Data is at the core of what we do at Duolingo, and we have the largest corpus of data about language learning anywhere in the world. How we handle this huge data volume is an interesting technical challenge in its own right, but it also has a direct connection to how we make decisions about the product. If you want to work on hard technical problems and connect the data to the product, we're hiring!