Many companies grow through paid marketing, but at Duolingo, our strategy is a little different! As of early 2023, ~80% of our users were acquired *organically*—maybe they followed us on social media or heard about us from a friend—and we maintain this organic growth by building the best product we can, and giving it away for free. Our hope is that eventually, learners will enjoy using Duolingo so much that they pay for a set of premium features—and it’s working! We’ve found that 7% of Monthly Active Users—and growing!—subscribe to Super Duolingo.
In other words: Our business grows because learners love our product and spread the word to their family and friends, some of whom eventually download the app and subscribe. Rather than investing marketing dollars to drive immediate revenue, we play the long game.
Sounds great, right? But maintaining a healthy ecosystem of Daily Active Users (DAUs) at various points in their lifecycle is a delicate balance. The more learners we have, the more diverse their needs become. To maintain organizational focus while serving this expanding, and evolving, population, we orient teams around movable metrics that matter, and then run hundreds of A/B tests to optimize for those metrics!
But how do you decide on the metrics that matter? And how do you advocate for an organization to adopt new metrics? And what happens if existing metrics stop moving? Our Data Science team developed a growth framework that helped to grow DAUs by 4x since 2019. Let’s explore the path that led us to that framework (the Growth Model), the tangible impact it’s had on our business, and how we’re thinking of evolving the framework to take us into a new phase of growth.
Getting our DAUs out of a rut
In 2018, after several years of strong year-over-year (YOY) growth, our DAU metric was stagnating. The team focused on growing DAUs was struggling to develop A/B tests with significant impact. So we rethought our approach: Could we refine our focus by optimizing metrics that drive DAU indirectly? In other words, how could we break up the DAU monolith into smaller, more meaningful (and hopefully, easier to optimize) segments?
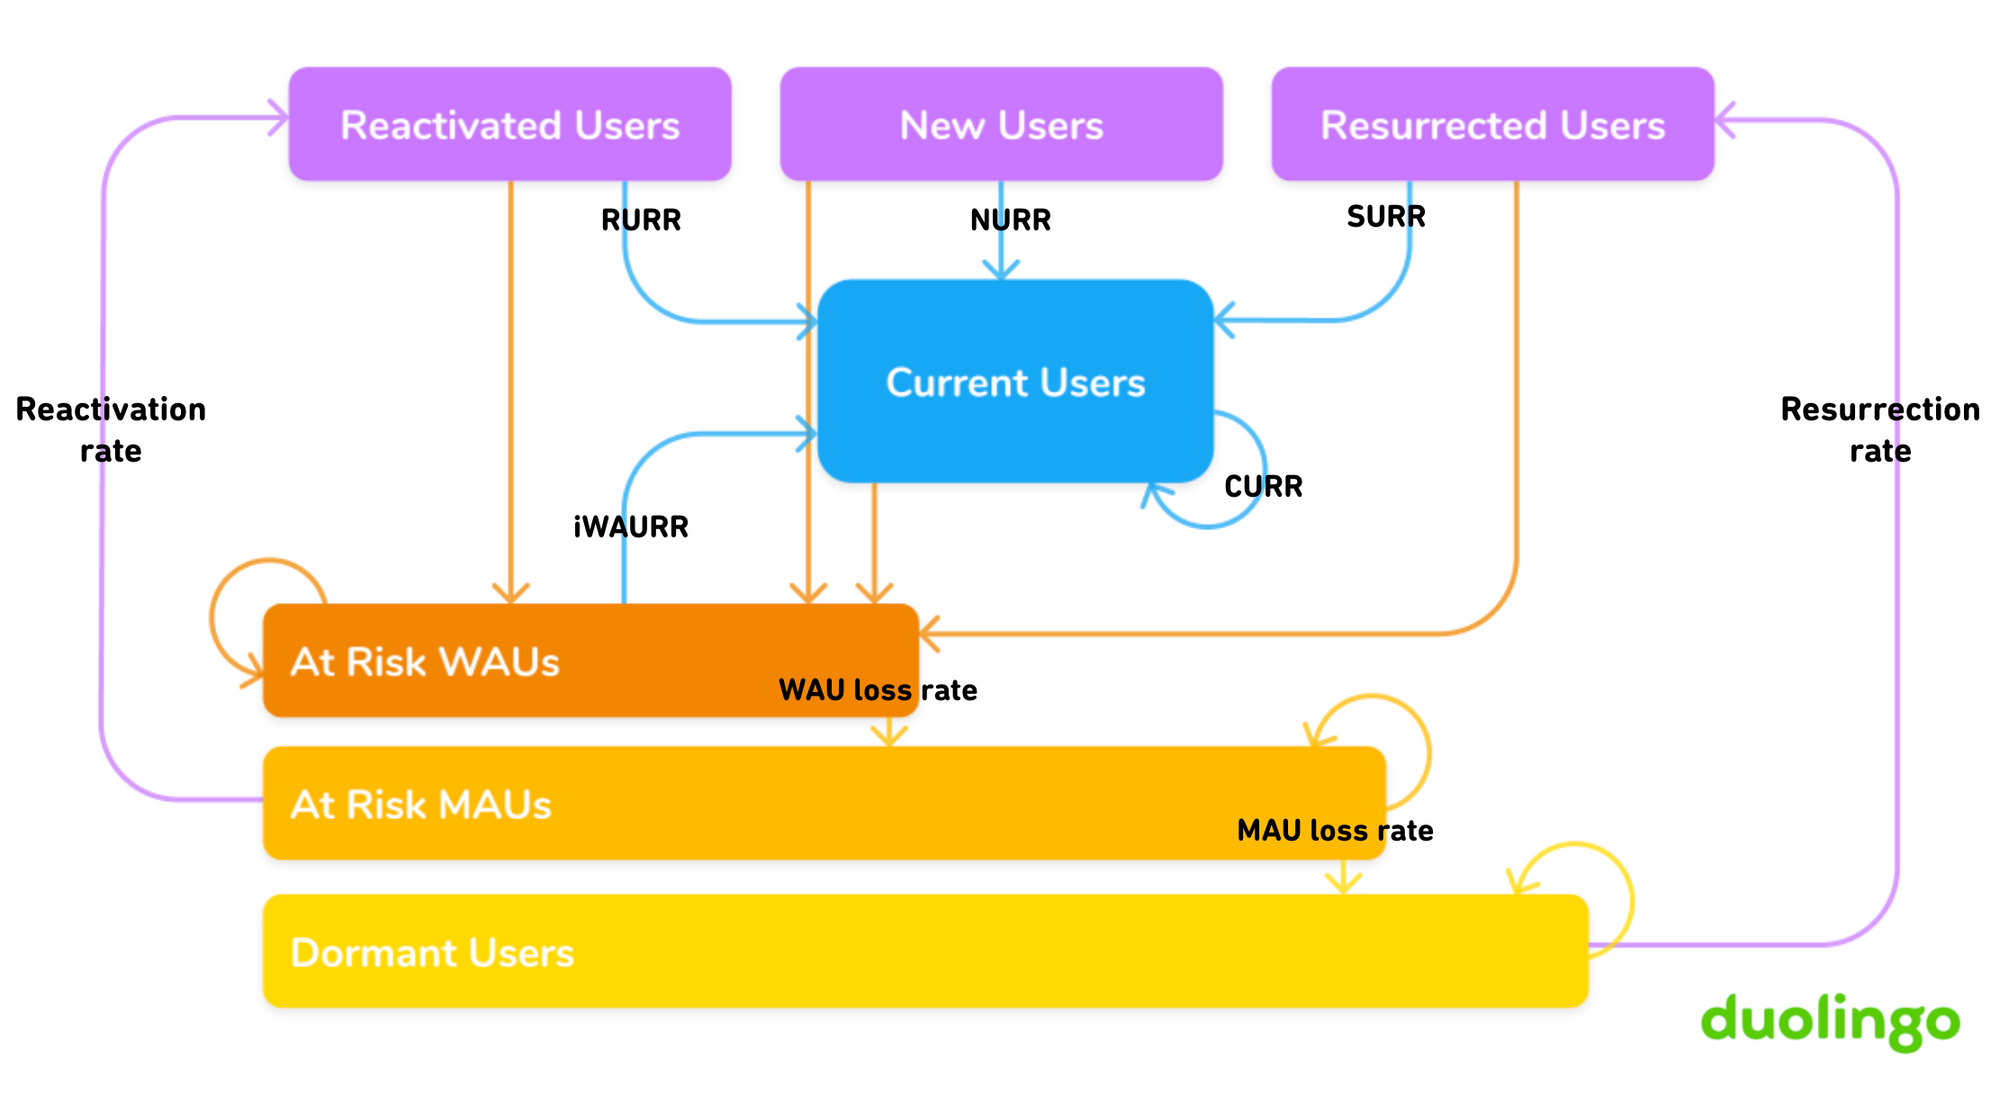
The Growth Model is a series of metrics we developed to jump-start our growth strategy with data. It is a Markov Model that breaks down topline metrics (like DAU) into smaller user segments that are still meaningful to our business. To do this, we classify all Duolingo learners (past or present) into an activity state each day, and monitor rates of transition between states. These transition probabilities are monitored as retention rates (e.g., NURR or New User Retention Rate), “deactivation” rates (e.g., Monthly Active User, or MAU, loss rate), and “activation” rates (e.g., reactivation rate).

The model above classifies users into 7 mutually-exclusive user states:
- New users: learners who are experiencing Duolingo for the first time ever
- Current users: learners active today, who were also active in the past week
- Reactivated users: learners active today, who were also active in the past month (but not the past week)
- Resurrected users: learners active today, who were last active >30 days ago
- At-risk Weekly Active Users: learners who have been active within the past week, but not today
- At-risk Monthly Active Users: learners who were active within the past month, but not the past week
- Dormant Users: learners who have been inactive for at least 30 days
As the arrows in the chart indicate, we also monitor the % of users moving between states (although we watch some arrows more closely than others).
As an example, let’s say a batch of New Users come to Duolingo for the first time on day 1. Some subset of those learners come back to study the next day as well: The proportion of day 1 learners who return on day 2 equals NURR. This day 2 transition puts these learners into another “active” state (Current User).
You might be asking yourself, “Could existing users be mistaken for “new users” if they get a new phone, or log in on a non-mobile device?” Lucky for us, our partners on the Engineering team developed a sophisticated approach to resolving user activity across multiple accounts called “aliasing.” Data Science works with data after it has undergone the “aliasing” process.
Now, what happens to those New Users on day 1 who don’t come back on day 2? They will transition into an “inactive” state (At Risk WAU). Because they’re currently inactive, they’re not a DAU. But they have still been active once in the last week (i.e., a WAU), hence the name of the state. Inactive learners remain in the At Risk WAU state for their first 7 days of inactivity.
After 7 days of inactivity, learners transition to the At Risk MAU state where they can remain for up to 22 days. Once learners are inactive for 30 days, they transition to the Dormant User state where they remain until they become active again.
Each “inactive” state (At Risk WAU, At Risk MAU, Dormant) has two transitions out of that state and at least two transitions into that state. Learners in the Dormant state can either remain inactive and stay in the same state day-to-day or transition to Resurrected if they become active again. Similarly, learners in the At Risk MAU state can stay inactive or transition to Reactivated if they decide to open up the app. (For specific calculations, see Appendix).
Finding our new “movable” metrics
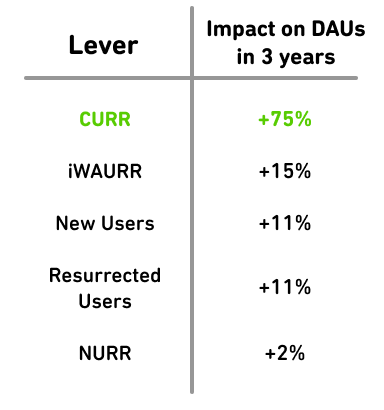
With the Growth Model in place and trained on historical data, we began to run growth simulations. The goal of these simulations was to identify new metrics that - when optimized - were likely to increase DAU. We did this by systematically pulling each lever in the model to see what the downstream impact on DAU would be. Here’s what it would look like if each transition state saw 2% month-over-month growth over a period of time:

The results were pretty clear cut: Increasing the Current User Retention Rate (CURR) 2% month-over-month had the largest impact on DAU. We staffed a team who started running A/B tests to see whether 1) CURR is a metric we can move and 2) moving CURR actually moves DAU (remember: correlation does not equal causation!). And they were successful! With a team now focused on optimizing a movable metric, growth in DAU kicked off again and we continue to see consistent, yearly growth.
This initial application of the Growth Model was only the beginning! This framework has become core to how we think about growing our product. We’ve used the Growth Model to…
- Build a statistical forecast of individual drivers, which then ladder into DAUs
- Set quarterly and annual goals for teams, above and beyond anticipated movement in the metrics
- Add new dimensions for analysis (i.e., user-level state labels, like Current User) to our in-house Analytics and Experimentation platform
Next up: evolving beyond aggregate metrics
In 2018, our DAU growth was stagnating and the Growth Model helped us identify new avenues for kickstarting growth. Fast forward to 2023… and DAU growth is strong and consistent. CURR was the key to unlocking this new phase of growth.
As CURR has inched higher and higher, we’ve begun asking ourselves two questions. The first: What is the ceiling for CURR? We know it’s not 100%. Sometimes people forget to complete a lesson, or have technical difficulties, or just want to take a break. (This is why we have the Streak Freeze - and an entire set of memes about Duo reminding learners to take their lessons!) We know we’re not quite at that ceiling yet (CURR keeps growing!) but we want to proactively head off a wave of stagnation as we approach that ceiling.
A careful reader will note that the Growth Model is calculated on an aggregate basis. This leads us to our second question: What opportunity are we leaving on the table by reducing a diverse learner base to a simple average? Averages are convenient and scalable, but we’ve found that because of our strong growth in CURR over the years our bases of Current Users has grown into a new monolith of users (90% of our DAU fall into this state!).
Why does this matter? Well, we’ve found that our aggregate metrics aren’t allowing us to see all of the distinct, diverse learners in each state. This means that CURR is an increasingly imprecise measure of Current User behavior, and we run the risk of this metric becoming hard to move (just like the 2018 problem we faced with DAUs!). It’s also harder to set reasonable goals and forecast accurately, which is increasingly important now that we are a public company.
With these questions in mind, we’ve begun exploring “bottom-up” methods for user segmentation as a complement to (and perhaps as an eventual replacement for) our current “top-down” method from the Growth Model. By turning to unsupervised learning techniques to allow unexpected patterns to emerge in the data, we’re also moving the organization away from analytical frameworks that can foster confirmation bias. The “top-down” nature of the Growth Model bakes in a lot of our preconceived notions about what matters for our business, while the “bottom-up” nature of our new approach will unlock new insights beyond “the path most taken.”
We’re excited to put this new idea into action and unlock our next phase of growth!
Special shoutout to a team of important collaborators on the foundational Growth Model work: Jorge Mazal, our former Chief Product Officer who had the original idea for the framework, and Vanessa Jameson, an engineering director at Duolingo who collaborated with me to bring the idea to life.
Appendix
We can trivially compute the number of unique learners who fall into each state on a given day by leveraging the transition probabilities from the prior day. Let’s take a look at the series of calculations needed to specify the value of each state on a given day.
Starting with our top-line company KPI, DAU, which is calculated by counting the unique learners in each “active” state on a given day (where t = some specific day):
High-level aggregated metrics like WAU and MAU are calculated similarly, but with some “inactive” states also included:
Active states are calculated in the following ways:
What about New Users? Learner’s initial transition into the model is unmeasured, though this is an extension to the model that we have considered. More on this below!
Inactive states are calculated as follows:
